

Categories
Idaho Real Estate, Buying & Selling Advice, EducationalPublished September 28, 2026
Chubbuck & Pocatello Housing Market Update — September 2026

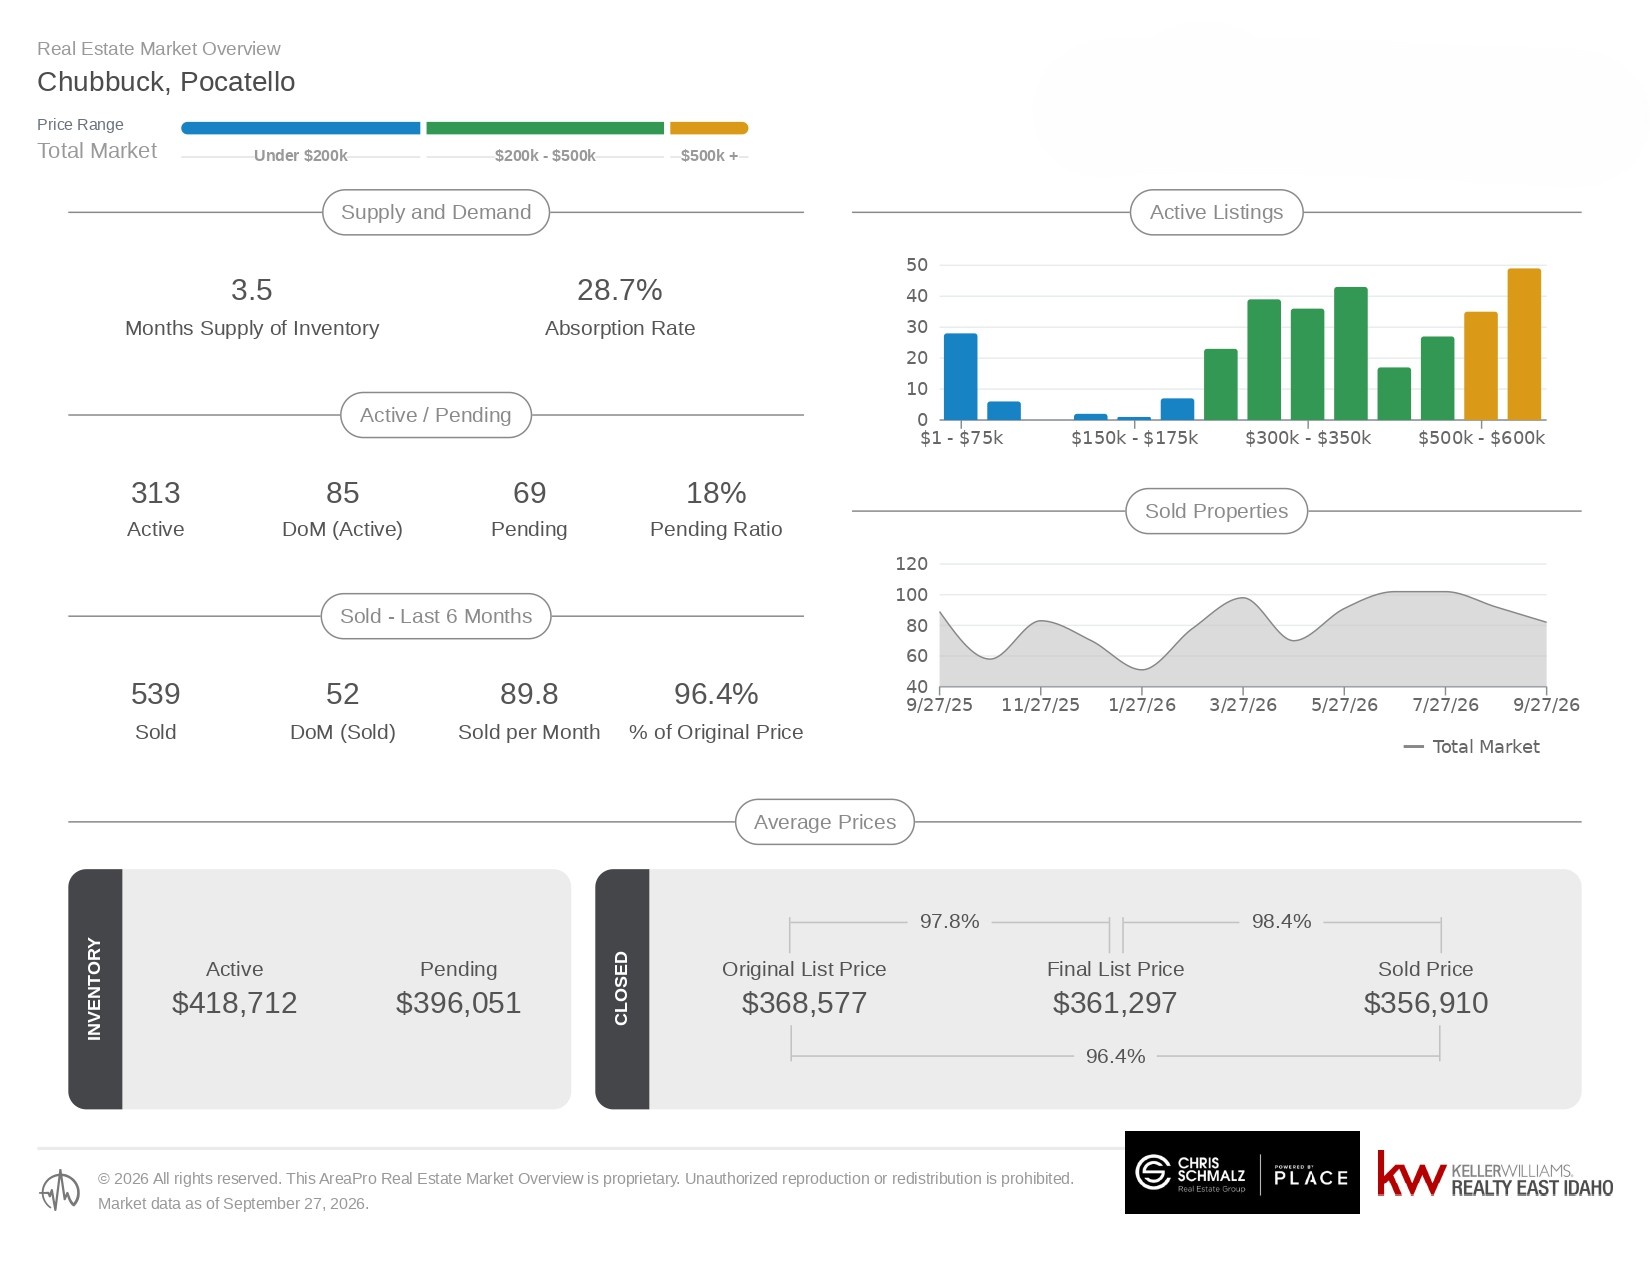
Market data as of September 28, 2026 | Chris Schmalz Group
The real estate market across Bannock County, particularly in Chubbuck and Pocatello, continues to demonstrate that while homes are moving, proper strategy is everything
Here is a breakdown of the September 2026 housing market trends in Chubbuck and Pocatello, along with tactical steps for local buyers and sellers
Key September 2026 Market Stats at a Glance
-
Supply & Absorption: 3.5 Months Supply of Inventory with a 28.7% Absorption Rate
-
Active Inventory: 313 Active Listings averaging 85 Days on Market (DoM)
-
Pending Activity: 69 Pending Listings with an 18% Pending Ratio
-
Recent Sales Performance: 539 homes sold over the last 6 months (averaging 89.8 sold per month) with an average of 52 DoM
-
Listing vs. Selling Prices: Sellers achieved 96.4% of their original list price, with final sales prices averaging 98.4% of the final list price
-
Average Prices: Active homes average $418,712, Pending homes average $396,051, Original List Prices average $368,577, Final List Prices average $361,297, and Sold Prices average $356,910
For Sellers: The Real Danger of the Pricing Gap
A primary takeaway from the data is the clear divide between homes priced correctly from the start and those that sit
Homes that sold over the last 6 months averaged 52 days on market
The pricing progression highlights the cost of starting too high
-
Average Original List Price: $368,577
-
Average Final List Price: $361,297
- Average Sold Price: $356,910
Sellers who overpriced ended up making price adjustments down to $361,297 before finally settling at an average sold price of $356,910
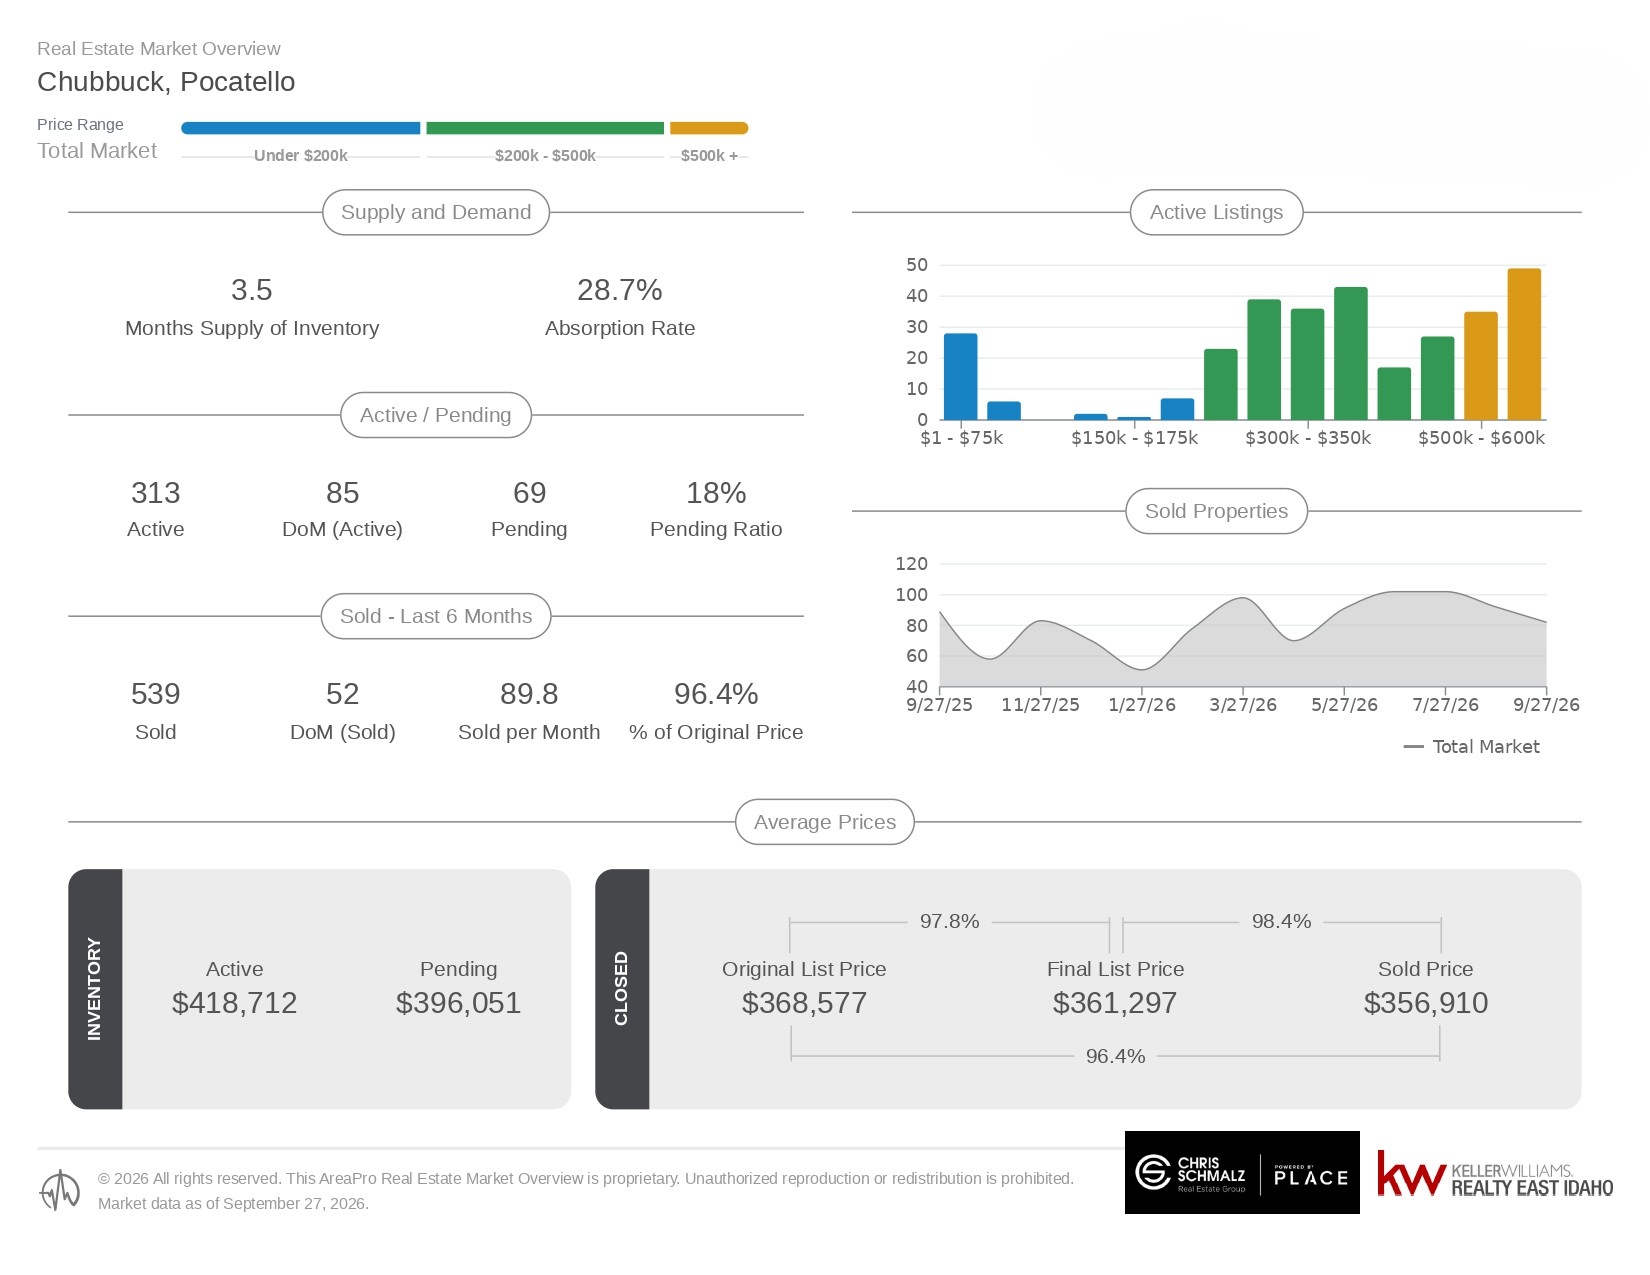
Market Dynamics & Competition across Price Bands
With 3.5 months of inventory, Bannock County leans slightly toward a seller's market, but conditions are far more balanced than peak hyper-competitive years
-
Under $300k: Lower price bands see faster movement, though active options under $200k remain relatively limited
-
$300k to $500k: Heavy competition exists in this mid-tier bracket, specifically within the $300k to $350k price band, which holds a dense cluster of active inventory
-
$500k+ Tier: Inventory stacks up significantly in the $500k to $600k range, which currently represents the single largest group of active listings on the market
Because inventory is heaviest in mid-to-upper price ranges, home presentation is vital
For Buyers: Identifying Opportunity and Leverage
While inventory remains tight relative to historical buyer demand, buyers hold negotiation leverage in specific areas of the market
With 313 active properties and 69 currently pending, selection exists across various neighborhoods in Chubbuck and Pocatello
Properties sitting above the 85-day average mark often represent motivated sellers
Work With Local Experts
Market averages provide a high-level view, but every property, neighborhood, and price point in Bannock County behaves differently
Reach out today for a personalized market analysis tailored directly to your home and goals
Chris Schmalz | Chris Schmalz Real Estate Group
Keller Williams Realty East Idaho | PLACE
25 years here. Still answering the phone

Chris Schmalz
Team Lead / Associate Broker | Chris Schmalz Real Estate Group | Keller Williams Realty East Idaho | PLACE
or another way