

Categories
Educational, Buying & Selling Advice, Idaho Real EstatePublished September 24, 2026
Jefferson Housing Market Update — September 2026

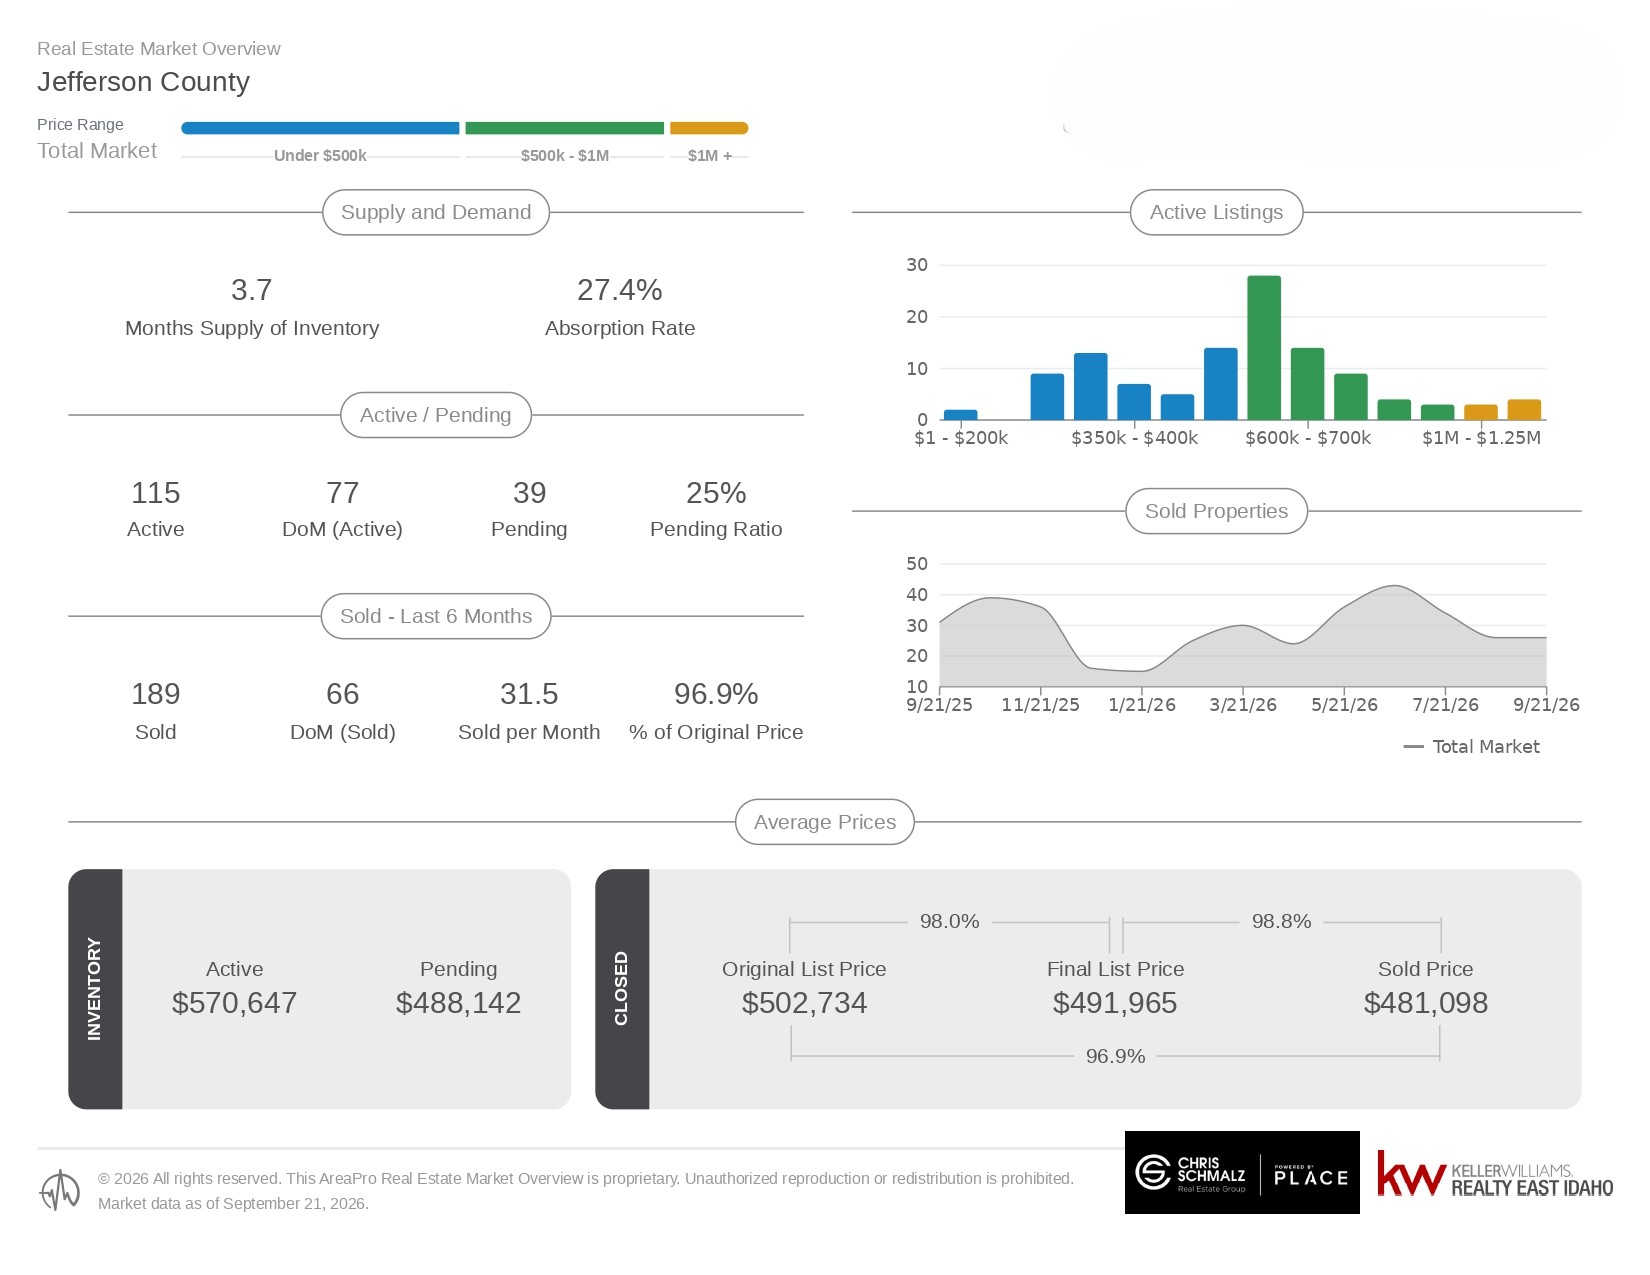
Market data as of September 22, 2026 | Chris Schmalz Group
The real estate market in Jefferson County continues to prove that while homes are moving, strategy is everything. Navigating current conditions requires looking beyond generic headlines and understanding local market signals. Supply levels, buyer behaviors, and property pricing dictate success whether you are preparing to list a property or searching for a place to call home.
Here is a breakdown of the September 2026 Jefferson County housing market trends, along with tactical steps for buyers and sellers.
Key September 2026 Market Stats at a Glance
- Supply & Absorption: 3.7 Months Supply of Inventory with a 27.4% Absorption Rate.
- Active Inventory: 115 Active Listings averaging 77 Days on Market (DoM).
- Pending Activity: 39 Pending Listings with a 25% Pending Ratio.
- Recent Sales Performance: 189 homes sold over the last 6 months (averaging 31.5 sold per month) with an average of 66 DoM.
- Listing vs. Selling Prices: Sellers achieved 96.9% of their original list price, with final sales prices averaging 98.8% of the final list price.
- Average Prices: Active homes average $570,647, Pending homes average $488,142, Original List Prices average $502,734, Final List Prices average $491,965, and Sold Prices average $481,098.
For Sellers: The Real Danger of the Pricing Gap
A primary takeaway from the Jefferson County data is the clear divide between homes priced correctly from the start and those that sit.
Homes that sold over the last 6 months averaged 66 days on market. Active listings currently sitting on the market average 77 days. That 11-day gap demonstrates how buyers evaluate properties. Modern buyers are well-informed, selective, and hesitant to pursue listings that appear overpriced. When a listing crosses into extended days on market, buyers begin to wonder if something is wrong with the property, giving them more leverage to negotiate.
The pricing progression also highlights the cost of starting too high:
- Average Original List Price: $502,734
- Average Final List Price: $491,965
- Average Sold Price: $481,098
Sellers who priced high ended up making price adjustments down to $491,965 before finally settling at an average sold price of $481,098. Overall, sellers received 96.9% of their original list price, losing roughly $21,636 off their initial expectations through price cuts and closing negotiations. Pricing a home based on recently closed sold comps rather than active asking prices protects equity and avoids unnecessary price reductions.
Market Dynamics & Competition across Price Bands
With 3.7 months of inventory, Jefferson County leans slightly toward a seller's market, but conditions are far more balanced than peak hyper-competitive years. Inventory concentration varies across price segments:
- Under $500k: This segment holds a solid share of active listings, including clusters around the $350k to $400k range. Demand in this bracket remains steady, with active pending listings averaging $488,142.
- $500k to $1M: Inventory stacks up significantly in this tier, particularly in the $600k to $700k range, which contains the largest single concentration of active listings in the county.
- $1M+ Luxury Bracket: Higher-end properties move at a slower pace, representing a smaller fraction of overall sales.
Because inventory is heaviest in mid-to-upper price ranges, home presentation is vital. When buyers have multiple active options in the $600k bracket, professional staging, high-quality media, and well-maintained property conditions drive showing requests and competitive offers. Furthermore, with active listings averaging an asking price of $570,647 compared to the average sold price of $481,098, an upper-end price gap exists where seller asking prices regularly exceed actual buyer activity.
For Buyers: Identifying Opportunity and Leverage
While inventory remains relatively controlled, buyers hold negotiation leverage in specific areas of the market.
With 115 active properties and 39 currently pending, selection exists across various neighborhoods. Buyers looking in price ranges above $500,000 will find more inventory to choose from, giving them time to evaluate options without feeling rushed.
Properties sitting above the 77-day average mark often represent motivated sellers. Sellers whose properties have been active for months are frequently more open to price concessions, repair credits, or closing cost assistance. Working with an experienced local agent allows buyers to identify these opportunities and draft realistic offers backed by recent market sales.
Work With Local Experts
Market averages provide a high-level view, but every property, neighborhood, and price point in Jefferson County behaves differently. Whether you are planning to list your property or buy a home in Rigby, Menan, Ririe, or surrounding areas, having an address-specific pricing strategy makes all the difference.
Reach out today for a personalized market analysis tailored directly to your home and goals.
Chris Schmalz | Chris Schmalz Real Estate Group| Keller Williams Realty East Idaho | PLACE
25 years here. Still answering the phone.
Market data provided by Area Pro, current as of September 22, 2026. Information deemed reliable but not guaranteed.

Chris Schmalz
Team Lead / Associate Broker | Chris Schmalz Real Estate Group | Keller Williams Realty East Idaho | PLACE
or another way